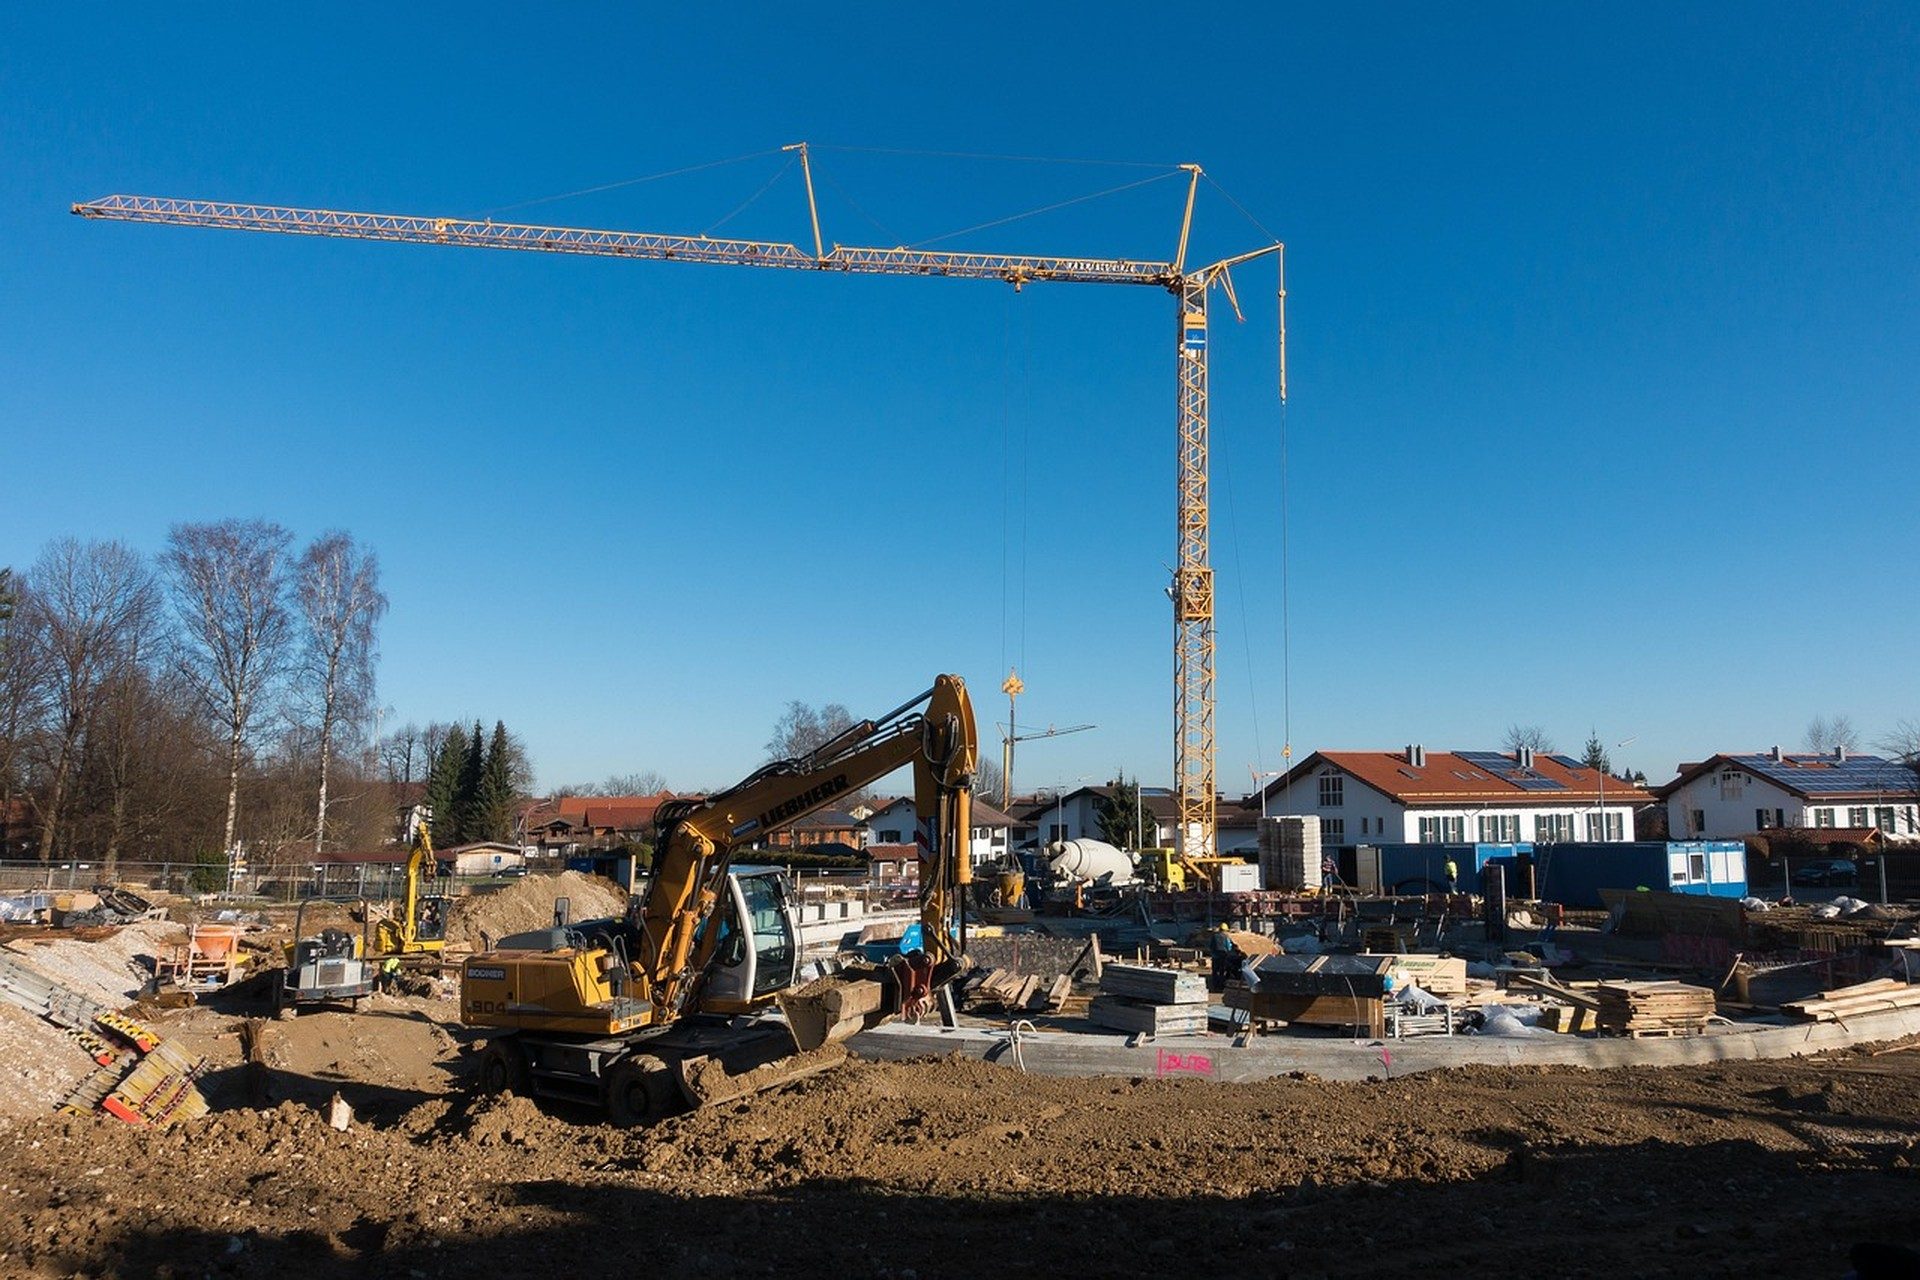
Reconstruction markets in Ukraine force insurers to price risks that change weekly, not yearly. Cross-functional teams of underwriters, civil engineers, finance officers, and municipal planners must share one clean data language or premiums drift far from reality. A solid ukraine mkt reconstruction insurance pricing taxonomy turns scattered field notes into comparable numbers that every role can trust.
Why Overnight Rebuilds Shatter Ordinary Premium Tables
Standard property tables assume stable roofs and known flood maps. After widespread damage, entire streets may vanish and reappear with new materials, altered foundations, and different occupancy patterns. Insurers who keep using pre-conflict rating factors quickly discover that quoted rates either scare capital away or leave portfolios under-reserved. Teams that treat reconstruction as a temporary phase miss how permanently the risk surface has shifted.
Local surveyors now walk sites where walls stand half-finished beside brand-new steel frames. Those mixed states demand fresh categories for partial occupancy, temporary power, and untested drainage. Without shared labels, the engineer’s structural report never reaches the actuary’s model in usable form. Pricing then relies on guesswork that later claim files expose as costly.
Core Buckets That Every Desk Can Read at a Glance
A practical taxonomy starts with five durable buckets that survive translation across languages and software. First comes physical integrity: wall type, roof age, seismic reinforcement, and fire-stopping quality. Second is location exposure: distance to active industrial corridors, residual mine risk, and seasonal river levels. Third covers use intensity: residential density, warehouse throughput, or school occupancy hours. Fourth tracks material provenance and inflation sensitivity. Fifth records financial continuity: owner liquidity, contractor track record, and reinsurance already attached.
Each bucket holds only measurable attributes. “Good condition” disappears; instead the field team records residual load-bearing capacity as a percentage and dates the last ultrasonic test. That discipline lets a finance officer in Lviv open the same file an engineer closed in Kharkiv and understand the numbers without a phone call. When the taxonomy stays this plain, the Foundation platform can store successive site visits as versioned rows rather than scattered PDFs.
Hazard Signals That Arrive Before the Calculator Opens
Pricing begins with signals that rarely sit inside traditional insurance systems. Satellite change detection flags sudden roof replacements. Customs data reveals spikes in imported rebar that may indicate rushed, lower-grade work. Municipal permit logs show whether new plumbing was inspected or simply connected. These signals must sit in the taxonomy’s early layers so they shape the base rate instead of appearing as last-minute adjustments.
Cross-functional groups that ignore early signals often discover double-counted risks. An engineer notes water damage; an underwriter separately loads a flood load; the combined premium becomes uncompetitive. Clear ownership of each signal prevents that overlap. Teams can check the FAQ (frequently asked questions) for common signal conflicts that have already been resolved in prior projects.
Currency and Import Cost Waves Inside the Rate
Ukrainian reconstruction quotes move with the hryvnia and with global steel prices. The taxonomy therefore tags every cost-sensitive item with both a local and a hard-currency reference. When the National Bank of Ukraine publishes updated exchange corridors, the pricing model can re-weight material components without rebuilding the entire file. This link between monetary policy and construction cost keeps premiums from lagging reality by months.
How Engineers and Actuaries Finally Speak the Same Dialects
Engineers describe residual strength; actuaries describe expected loss cost. The taxonomy inserts a short translation table: residual strength of 70 percent maps to a defined severity multiplier; residual strength of 40 percent maps to another. Both sides agree on the mapping once, then apply it automatically. That single agreement eliminates hours of clarification emails that once delayed every large account.
Finance teams add a third dialect focused on cash-flow timing. They need to know when a temporary repair becomes a permanent rebuild and whether the policy period covers both stages. By embedding stage markers inside the taxonomy, the same data set answers questions from three desks without reformatting. Readers who want wider market context can browse the Market Trends archive for parallel cases across sectors.
Material Inflation Layers That Change Coverage Geometry
Material prices have swung more violently than labor costs. A taxonomy that fails to isolate rebar, concrete, glass, and insulation inflation will mis-price both the sum insured and the deductible. Cross-functional teams now attach a quarterly inflation vector to every major building component. When the vector updates, the premium recalculates only the affected layers rather than the whole structure.
Teams studying cost pressure often consult the detailed checklist at Construction Materials Inflation in Ukraine: Technical Due Diligence Checklist. That resource supplies the exact measurement methods that keep inflation tags consistent across regions. Without such consistency, a Kyiv office and an Odesa office will quote different rates for identical buildings simply because their inflation assumptions diverge.
Coverage Stacks Across Housing, Roads, and Factories
Reconstruction rarely rebuilds one asset class in isolation. A residential block may share utilities with a neighboring light-industrial plant and a rebuilt road. The taxonomy therefore records shared infrastructure as separate but linked entities. Pricing can then allocate premium to the correct policy while still recognizing common-cause events such as a single transformer failure that hits all three.
International lenders require this clarity before they release funds. The World Bank Ukraine country program and the EBRD Ukraine program both examine whether insurance data separates private and public layers cleanly. When the taxonomy meets that standard, capital moves faster and premium rates stabilize.
Trade Corridors That Shape Risk Transfer Options
Poland remains a critical logistics bridge for materials and for reinsurance capacity. Operators who understand how goods and risk capital actually cross the border can price more accurately. The technical overview at Poland Ukraine Trade Association Bridges: Technical Deep Dive for Operators shows which documentation packages satisfy both customs and underwriting desks. That knowledge feeds directly into the taxonomy’s “transfer readiness” field.
Refreshing Rates When New Rebuild Data Lands Weekly
Static annual renewals cannot keep pace with Ukrainian reconstruction. The taxonomy therefore supports incremental updates: a new roof inspection overwrites only the roof attributes; a completed utility connection overwrites only the service flags. Pricing engines re-run only the changed layers, producing a revised quote within hours rather than weeks. This cadence matches the speed of actual site progress.
Public recovery dashboards supply one continuous feed. The official Ukraine recovery portal lists completed and planned projects by region. Cross-functional teams map those public records against their private site files so that premium adjustments rest on verified milestones rather than optimistic contractor schedules. Macroeconomic context from the IMF Ukraine country analysis further calibrates the inflation and growth assumptions that sit behind every rate.
Avoiding Double Counts That Quietly Inflate Every Quote
The most expensive taxonomy errors are invisible until claims arrive. An engineer loads residual war risk; an underwriter loads the same risk again under a different label; the insured pays twice. Clear ownership rules inside the taxonomy assign each residual risk to exactly one owner and one calculation path. Periodic audits compare field notes against the stored attributes and flag any orphan or duplicated entries.
New team members learn the rules quickly because the labels themselves explain their purpose. No one needs a 40-page manual when every field name already states what it measures and who updates it. Additional practical examples appear regularly on the Blog, giving practitioners short case studies they can apply the next morning.
Looking ahead, the same structured approach will shape larger property decisions. Readers tracking residential absorption can examine the Kyiv Real Estate Market Outlook for 2026 to see how accurate insurance pricing feeds buyer confidence and developer financing. When every participant trusts the data taxonomy, reconstruction capital stays in motion and premiums remain grounded in measurable fact rather than rumor.
See also Foundation platform.
Related Foundation reading: FAQ: Where Can Journalists Verify Claims About Dnipro Industrial Outpu and FAQ: How Do Experts Define Women Founder Networks in Ukraine?.
Timeless Value. Perpetual Legacy.