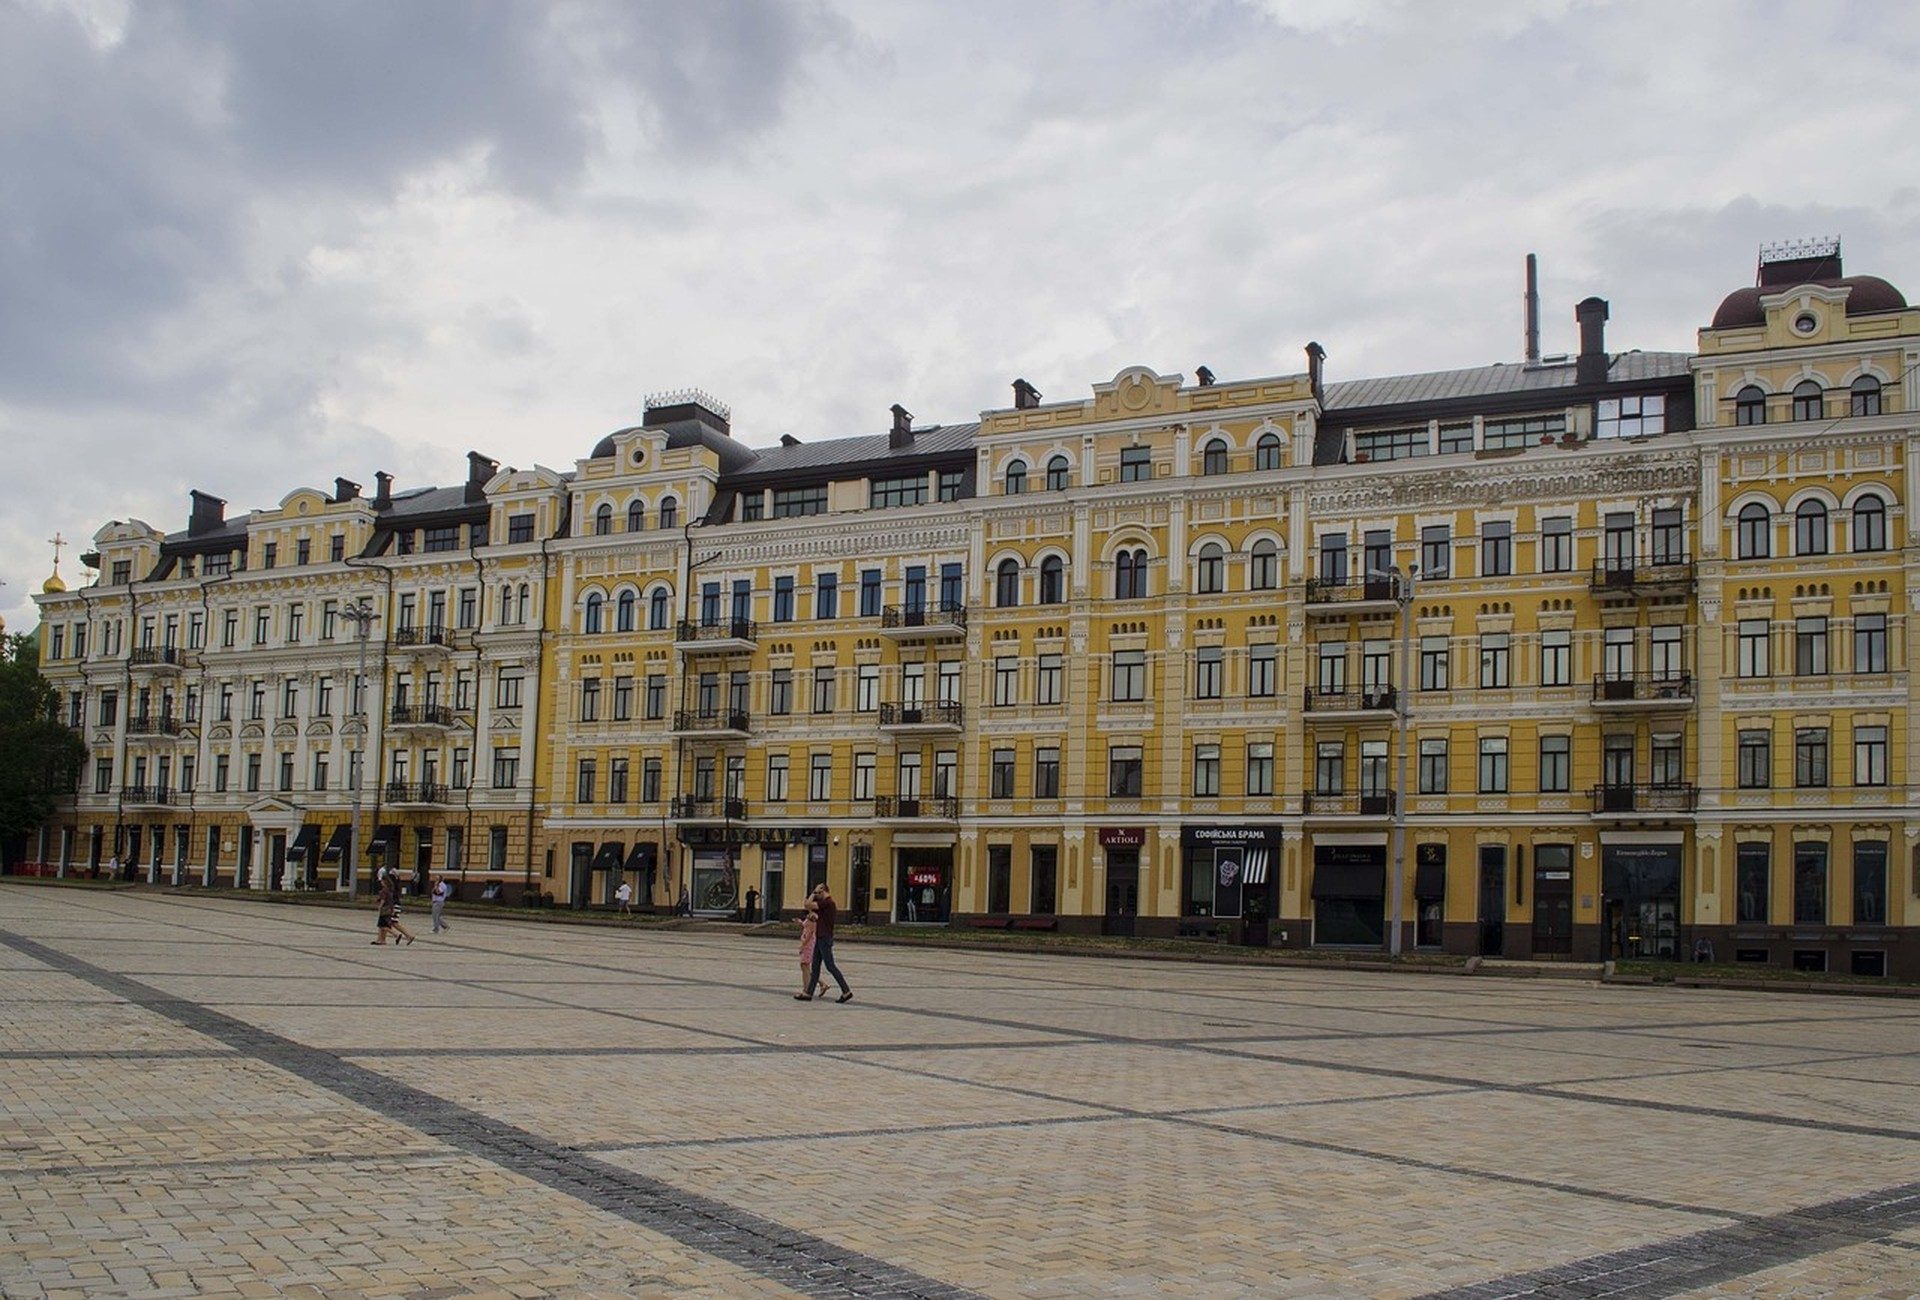
Kyiv price recovery is not a single citywide percentage. Prime corridors, secondary stock, and damaged or legally unclear assets reprice on different calendars that blended indices obscure. Disciplined tracking of price recovery kyiv corridors requires corridor maps, structural soundness filters, sample size notes, and insurance status foreign capital can audit before basis decisions rest on skyline photography. This guide explains how to track price recovery across Kyiv's prime corridors without treating thin prints as a full market rebound.
Begin with satellite town dynamics in Bucha and Irpin: Satellite Towns in the Reconstruction Cycle and accession capital context in What EU Accession Means for Cross-Border Property Investors so central corridor recovery is not read in isolation from metropolitan and policy restructuring.
What recovery means in a reconstruction market
Recovery can mean higher closed prices, shorter days on market, tighter list to sale gaps, or improved bid depth. In Kyiv, recovery also means more assets returning to the effective market as title, insurance, and repair status clarify. Committees should define which recovery metric they use and refuse packets that switch definitions mid series.
EU accession investment implications in What EU Accession Means for Cross-Border Property Investors can change medium term capital availability and therefore recovery speed without immediately moving current closed prices.
Macro and recovery funding context from the International Monetary Fund publications helps committees date assumptions about external financing that support reconstruction linked demand.
Prime corridor definitions committees can share
Prime corridor maps should name districts and street level boundaries used in the analysis. Without shared geography, two brokers can report different recovery stories for the same city. Foundation Ukraine packets lock corridor definitions and attach them as a one page map legend before price tables.
Supply constraints for sound stock in Supply Constraints in Kyiv's Structurally Sound Housing Stock explain why prime corridor prices can firm while broader city averages lag.
Structural soundness and effective inventory
Buildings with unresolved damage, restricted access, or incomplete documentation are not effective inventory even if they appear in cadastral counts. Price recovery series must filter for assets that can actually transact. Otherwise recovery looks slower than experienced buyers observe in prime sound stock.
Sample size, cash deals, and thin market risk
Low transaction counts make quarterly medians noisy. Packets should show deal counts, cash versus financed mix where known, and confidence ranges rather than false precision. One trophy sale does not define a corridor.
Statistical and economic releases from the State Statistics Service of Ukraine provide national context committees should not confuse with corridor level broker samples.
Insurance, title, and bankability as price drivers
Bankable assets with clearer title and insurance options can recover faster than assets that only cash buyers will touch. Recovery analysis without bankability notes misstates who can bid and at what leverage. Cross border investors need counsel and local operator input on these filters before modeling leveraged IRRs.
European policy and integration context from the European Union matters when accession related reforms improve property rights enforceability and capital market access over multi year horizons.
Currency and reporting base
Prices reported in dollars, euros, or hryvnia can tell different recovery stories when FX moves. Series must state currency and conversion methodology. Foreign investors should track both local and home currency paths.
Satellite towns versus central prime
Satellite reconstruction cycles in Bucha and Irpin can diverge from central Kyiv prime corridors. Relative value trades that ignore infrastructure repair calendars and school and service restoration misread where demand returns first. Corridor packets should include a metropolitan comparison panel.
World Bank reconstruction and development materials at the World Bank Ukraine overview help committees frame multi year infrastructure constraints that affect corridor accessibility and services.
Platform orientation for multi geography capital appears on the Ukraine platform hub.
OECD country and reconstruction related economic surveys from the OECD support external benchmarking when sponsors claim recovery speeds without third party macro context.
Vote ready recovery packets
Packets open with corridor definitions, soundness filters, deal counts, and currency notes. Bankability and insurance appendices belong next. Satellite comparison and accession capital notes complete the file. Foundation Ukraine recovery governance applies five gates: metric definition before recovery claims, corridor maps before city averages, soundness filters before inventory counts, sample size before medians, and bankability before leveraged models.
Corridor recovery tables can be cross checked against other series in the Market Trends archive. Method questions can be sent via the Faq; field color sometimes appears on the Blog.
Include corridor maps, deal counts, and soundness filters in the next packet before capital treats thin Kyiv prints as full price recovery across all prime corridors.
Building a living corridor dashboard
Price recovery tracking improves when staff maintain a living dashboard rather than a quarterly PDF that is already stale at print. A living dashboard includes corridor definitions, latest deal counts, median and dispersion notes, soundness filter status, and links to source memos. Updates can be weekly in active periods and monthly when volumes are thin.
Dashboard discipline also forces honest uncertainty labels. When a corridor has fewer than a threshold number of deals, the dashboard should show insufficient sample rather than a fake median. Committees make better decisions with explicit unknowns than with false precision.
Local operator inputs should be time stamped and attributed. Anonymous market color without dates is hard to audit. Named notes with observation dates can be challenged and improved. Foundation Ukraine prefers attributable color plus data over unattributable stories.
Dashboard outputs should feed allocation calendars: which corridors are open for new diligence, which are watch only, and which are paused. Recovery tracking that does not change the calendar is incomplete work.
Recovery tracking should separate asking prices from closed prices and should never blend them in one series without labels. Asking price firmness can precede closed price recovery or can reflect wishful listing behavior. Committees need both series with clear legends.
When foreign media report a single citywide rebound percentage, staff should recompute the claim on corridor definitions used internally. External numbers can be useful, but only after translation into Foundation geography and filters.
Communicating recovery uncertainty to co investors
Co investors differ in risk tolerance and in how they read thin market data. Recovery communications should present ranges, sample sizes, and decision thresholds rather than a single recovery percentage. Ranges invite adult conversation; false precision invites false confidence.
When a corridor moves from pause to open diligence, explain which metrics crossed thresholds. When it returns to pause, explain with the same clarity. Symmetric communication builds credibility across cycles.
Avoid mixing humanitarian narratives with price recovery mathematics in the same paragraph. Both matter in different parts of a responsible platform voice, but mixing them confuses underwriting. Keep human context in designated sections and keep price math auditable.
When presenting recovery to foreign investment committees, lead with methodology before numbers. Methodology first reduces later debates about whether the number was real. Numbers first invite skepticism that methodology slides never fully repair.
If two data vendors disagree on corridor recovery, show both and explain which Foundation uses for decisions and why. Hiding disagreement is worse than explaining it.
Corridor dashboards should link out to the city baseline in Kyiv Real Estate Market Outlook for 2026 only as a secondary reference, never as a substitute for the corridor map and deal count table that define recovery in this file.
Timeless Value. Perpetual Legacy.